Dashboards have become an important part of modern business. Companies use them to monitor sales, website traffic, customer activity, marketing campaigns, finances, inventory, and operational performance. A well-designed dashboard can turn large amounts of information into an easier-to-understand visual summary.
However, building a useful dashboard has traditionally required more than simply choosing a few charts. Users may need knowledge of databases, data connections, formulas, visualization tools, and sometimes programming.
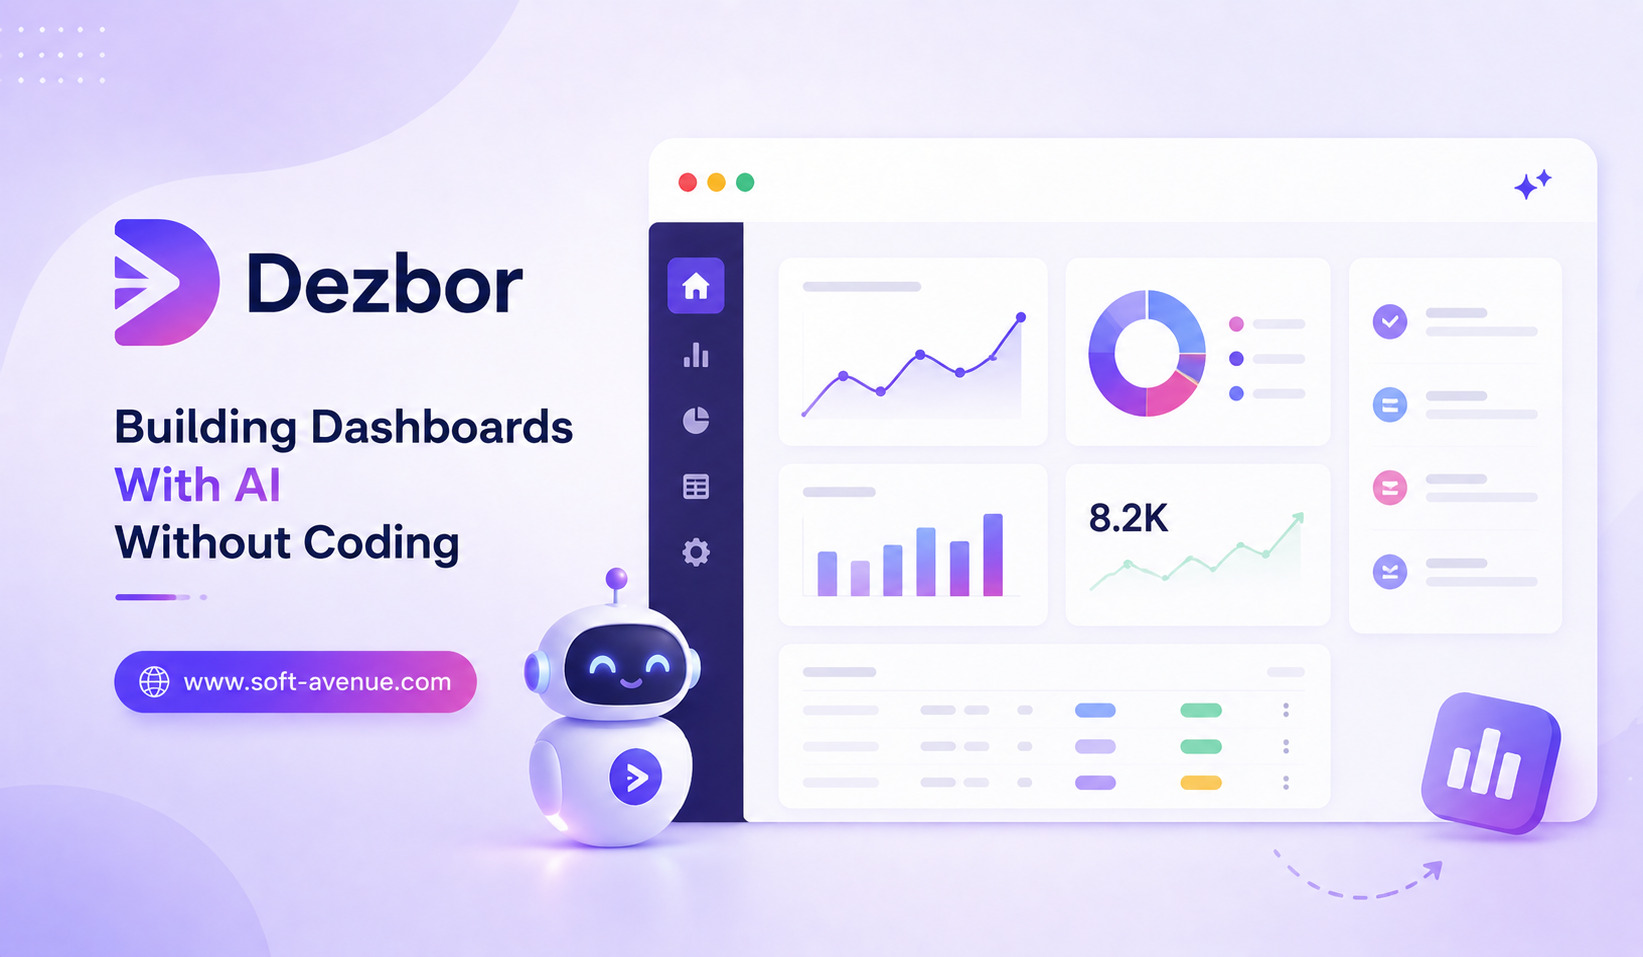
Dezbor represents a newer approach to dashboard creation: using AI to build dashboards without coding.
Instead of manually configuring every component, users can describe what they want in natural language and allow AI to help transform their requirements and data into a dashboard. This approach can make data visualization more accessible to people who do not have technical backgrounds.
What Is Dezbor?
Dezbor can be understood as an AI-powered approach to creating dashboards and data-driven interfaces without requiring traditional programming skills.
A conventional dashboard-building process might involve connecting a database, selecting data fields, writing queries, configuring charts, arranging widgets, and setting up filters.
For non-technical users, this can be intimidating.
An AI-first dashboard builder changes the starting point. Rather than requiring users to understand the technical implementation first, they can explain the information they want to monitor.
For example, a business owner might request a dashboard showing monthly revenue, customer growth, sales performance, and the best-performing products.
AI can use that description as a starting point for generating the dashboard structure.
Why No-Code Dashboards Matter
Businesses generate enormous amounts of data, but not everyone working with that information knows how to code.
Marketing managers may understand campaign performance but not SQL. Sales managers may know which metrics matter but not how to build data visualizations. Small-business owners may want a simple overview of operations without hiring a developer.
No-code tools help close this gap.
When AI is added to the process, users can describe their requirements naturally instead of manually configuring every component.
This can make dashboard creation faster and more approachable.
How AI Dashboard Building Works
The process generally starts with a description of the desired dashboard.
A user can explain what data they want to see, how they want it organized, and which metrics are important.
For example:
“Create a sales dashboard showing revenue by month, sales by region, customer growth, and the top five products.”
An AI-powered system can interpret the request and generate an initial dashboard design.
The user can then refine it through additional instructions.
They might ask to add a date filter, change a chart, create a comparison, or highlight a particular metric.
This conversational workflow can reduce the need to understand the technical details behind each visualization.
Building Dashboards Without Coding
The biggest advantage of an AI dashboard builder is accessibility.
Users do not necessarily need to know programming languages or database query syntax to get started.
Instead, they can focus on business questions.
For example, a marketing manager might want to know:
- Which campaigns generate the most leads?
- How has website traffic changed?
- Which channels provide the strongest conversion rate?
- What is the cost per acquisition?
Rather than manually constructing charts for each question, the user can communicate the desired analysis to the AI system.
This shifts dashboard creation from a technical activity toward a more business-oriented workflow.
Turning Raw Data Into Visual Information
Raw data can be difficult to interpret.
A spreadsheet containing thousands of rows may contain useful information, but identifying important patterns manually can take time.
Dashboards provide a visual layer.
Charts, graphs, numbers, filters, and summaries can make trends easier to recognize.
AI can potentially help decide which types of visualizations are appropriate for different types of data.
For example, a time-series trend may be better represented through a line chart, while category comparisons may work better with bars.
The final choice should still be reviewed by the user because a visually attractive chart is not automatically a useful one.
AI Dashboards for Small Businesses
Small businesses can particularly benefit from simpler dashboard creation.
Large companies may have dedicated data analysts and business intelligence teams. Smaller companies often depend on spreadsheets and manually prepared reports.
An AI-powered dashboard can help organize business information into a centralized view.
A restaurant owner might monitor daily sales and popular menu items. An online store could track orders, revenue, and product performance. A service business could monitor leads, bookings, and customer retention.
The dashboard becomes a single place for reviewing important metrics.
Marketing Dashboards
Marketing generates data from many sources.
Businesses may track search traffic, social media activity, advertising campaigns, email performance, and conversions.
An AI dashboard can potentially bring these metrics together.
Instead of opening multiple platforms, marketers could use a centralized dashboard to review important performance indicators.
The value comes from connecting the numbers to business decisions.
A dashboard should not simply display dozens of metrics. It should help answer questions such as which campaigns are working, where customers are coming from, and where marketing budgets may need adjustment.
Sales Dashboards
Sales teams can use dashboards to monitor their pipeline.
Important information may include new leads, qualified prospects, deals in progress, conversion rates, sales targets, and revenue.
An AI-assisted dashboard could help organize this information and highlight changes.
For example, a sales manager could request a view showing current performance against monthly targets.
This can make it easier to identify areas that need attention without manually calculating every figure.
Operations and Project Management
Dashboards are also useful outside sales and marketing.
Operations teams can monitor inventory, delivery times, production metrics, customer requests, or service performance.
Project teams can track deadlines, task completion, workloads, and progress.
AI can potentially help create different dashboard views based on the needs of different teams.
This flexibility can make dashboards more useful across an organization.
Natural Language Makes Data More Accessible
One of the most interesting aspects of AI dashboards is the use of natural language.
Traditional business intelligence tools often require users to understand how data is structured.
AI can provide a conversational layer.
Instead of thinking about database fields and visualization settings, users can describe the question they want to answer.
For example:
“Show me which products had the biggest sales increase compared with last month.”
The system can potentially interpret that request and create an appropriate analysis.
This does not eliminate the importance of understanding data, but it can reduce the technical barrier to accessing it.
Accuracy Is More Important Than Appearance
AI-generated dashboards need to be checked carefully.
A dashboard may look professional while presenting incorrect calculations.
Users should verify that the underlying data is accurate, filters work correctly, calculations are appropriate, and dates or categories are interpreted properly.
This is particularly important for financial, sales, and operational dashboards.
AI should assist with visualization and analysis, but important business decisions should not rely on unchecked outputs.
Data Privacy and Security
Dashboards can contain sensitive business information.
Revenue figures, customer details, employee data, financial information, and internal performance metrics may all need protection.
Before connecting data to an AI-powered dashboard platform, businesses should understand how information is processed and stored.
Access controls should also be configured so employees only see information appropriate to their roles.
For businesses handling sensitive customer information, privacy should be considered before implementation.
Limitations of AI Dashboard Builders
AI-powered no-code dashboards are not suitable for every situation.
Highly complex organizations may require advanced business intelligence systems with detailed governance, custom data models, and sophisticated analytics.
AI-generated dashboards may also need manual adjustments when business requirements are unusual or highly specialized.
Another limitation is that users still need basic data literacy.
AI can create a visualization, but users need to understand what the numbers mean and whether the analysis makes sense.
The technology can simplify the process without eliminating the need for informed decision-making.
The Future of AI-Powered Data Visualization
The combination of AI and no-code development is likely to change how people interact with business data.
Instead of opening a dashboard and searching through predefined charts, users may increasingly ask questions directly.
An AI system could generate a relevant visualization, explain a trend, compare periods, and help users explore the next question.
This could turn dashboards from static reporting tools into interactive analytical environments.
Final Thoughts
Dezbor represents the growing idea that AI can make dashboard creation accessible without traditional coding.
By allowing users to describe what they want to monitor, AI can potentially simplify the process of designing charts, organizing metrics, and creating data-driven interfaces.
For small businesses, marketers, sales teams, project managers, and other non-technical users, this can reduce the barrier to building useful dashboards.
However, AI should not replace data validation or human judgment. Businesses still need accurate data, appropriate metrics, strong security practices, and people who understand what the numbers actually mean.
The future of dashboard creation may be less about manually configuring every chart and more about asking better questions. If AI can translate those questions into useful visualizations, building a dashboard could become as simple as describing the business information you want to see.
